Git Commands Cheat Sheet: The Commands You’ll Use Every Day
A no-frills reference for the common git commands that come up in day-to-day work, grouped by what you’re trying to do. Copy it and then paste it into your console. Anywhere is says <something> in the git command list, these are just placeholders. Replace them with your own command (file, url, etc.) including replacing the < and >
Setup: Starting or joining a project
Starting a new repository:
git init
Download a copy of an existing remote repository:
git clone <url>
Set the name to attach to your git commits:
git config --global user.name "Your Name"
Set the email address to attach to your git commits:
git config --global user.email "your@domain.com"
Basic Everyday Tasks
See what’s changed, staged, or tracked in the codebase
git status
See what’s changed, staged, or tracked in the codebase
git status
Stage every changed file in the current folder:
git add .
Stage a specific file
git add <file>
Save staged changes as a commit with a message
git commit -m "Your message"
Show all unstaged changes line by line
git diff
Local Branching
List all the local branches
git branch
Create a new branch and switch to it
git switch -c <new-branch-name>
Switch to an existing branch
git switch <branch-name>
Merge a branch into your current branch
git merge <branch-name>
Remotes
Fetch and merge the latest changes from the remote:
git pull
Upload your committed changes
git push
Push a new branch and link it to the remote
git push -u origin <branch>
List all remotes that this repository is connected to:
git remote -v
Reviewing The Repo History
Show a compact view of the commit history
git log --oneline --graph
See exactly what was changed during a specific commit:
git show <commit>
See who last made a change to a specific file:
git blame <file>
Undoing Things
Discard uncommitted changes to a file:
git restore <file>
Undo to last commit but keep the changes that are staged:
git reset --soft HEAD~1
Create a commit that undoes an earlier commit
git revert <commit>
Shelve your uncommitted changes so you can switch context:
git stash
When Digital Identity Mismatches Cause Systemic Harm: Infrastructure Challenges and Legal Gaps
This article explores how digital identity systems fail when personal data changes, highlighting legal rulings, infrastructural inertia, biometric limitations, and the resulting social exclusion and systemic risks.
A government database is not a neutral record of who you are. It’s an infrastructure, and like all infrastructures, it embeds assumptions about what stays fixed and what is allowed to change. When those assumptions are wrong, the people who fall outside them don’t experience a glitch. They experience what I’ve come to think of, following the structural violence literature, as a slow, distributed harm, one that rarely announces itself as a single event, but accumulates instead across a thousand small refusals.
This is the story of what happened after India’s Supreme Court tried to change one of those assumptions, and what that reveals about identity infrastructure more broadly.
NALSA and the Limits of Legal Recognition
In National Legal Services Authority vs Union of India (2014), the Court recognised transgender people as a third legal gender category and affirmed a right to self-identification without surgery, without a medical certification, and without judicial sign-off. When read against the global landscape of gender recognition law at the time, this was a remarkable decision. It remains one of the most expansive judicial statements on gender self-determination anywhere.
However, the judgement itself is not an infrastructure, and infrastructures do not update themselves. The participant in my study were doctors, welfare officers, transgender people, and NGO workers. They told me how their lives and work had been shaped in the ten years after this change, how the digital identity infrastructure developed gradually, and how it played a major part in shaping what the law says a person is entitled to. At the database level, in the structure of an application form, or the discretion exercised by a registration clerk, we can see how the slow changes to an infrastructure can lead to people being excluded. Leigh Star made this point about infrastructure decades ago, showing how it only becomes visible when it breaks. For most people, an identity system is invisible precisely because it works. For a transgender person in post-NALSA India, the system becomes visible constantly, at every counter, every renewal, every moment where a self-identified gender meets a field that was never built to hold it.
The Category Was Never Built For This
Bowker and Star spent years documenting how classification systems render people unintelligible within a system. They looked at the ways that a category built for one purpose gets weight added to it by every system downstream. Aadhaar’s gender field is a small, blunt example of this. It’s one binary value, entered once, and it quietly holds up the banking and financial services system, the welfare system, the health system, the education enrollment system, and many other bureaucratic systems in the public and private sector. No one sat down and decided to exclude transgender people from Aadhaar and the health and welfare systems. They just never asked whether a value such as gender would needed to be changed the way that a name might need to be changed after registration.
NALSA exposed how brittle that design assumption already was. The ruling changed overnight, but it took the infrastructure a decade to catch up. Adding a third value to a database field is trivial engineering. But it’s not trivial to propagate changes to a value correctly through every downstream system that depends on the original record. An Aadhaar number touches bank details, voter registation records, school records, the PAN financial services number, and welfare enrollment. Each of these systems was built independently, on its own timeline, often by different vendors, and each carries the same unexamined assumption of stability.
The result, the for person at the centre of it, is not one singular failure but a cascading of failures and breakdowns. A gender marker updated with one authority remains unchanged with three others. Each disagreement becones its own small confrontation. An account might be flagged for review, a benefit claim delayed or cancelled, a hospital record that doesn’t reconcile and shapes continuation of care for the patient. These systems were never designed to expect a person to change.
Where Law Meets The Registration Desk
This is where I think an information systems lens adds something to the legal literature. NALSA’s language on self-identification was unambiguous. However, the registration desk, the bank branch, the welfare officer, these are a separate empirical question, and one that I’ve spent considerable fieldwork time on. Local officials, working with outdated departmental circulars or simply being unfamiliar with the judgement, have continued to demand medical proof that the ruling explicitly waived.
I’d argue that this is where the actual work of exclusion happens. It’s not in the statute. It’s at the registration desk, months or years after the statute was decided. The law is not self-executing. It has to be carried, imperfectly, through layers of bureaucratic infrastructure and human discretion, and at every layer there is room for the original intent to be diluted, misunderstood, or simply ignored. Studying identity systems only at the level of policy systematically misses this because it only asks whether the right law exists. To see where recognition actually breaks down, you have to look at the infrastructure itself, and the people operating it.
Biometric Infrastructure and the Assumption of a Fixed Body
Biometric identity systems using fingerprints and facial matching carry their own version of this problem. They’re built on an implicit model of the body as stable and fixed over time. Someone whose facial presentation changes during transition, or whose biometric enrollment predates that transition, can trigger automated non-matches that have nothing to do with fraud and everything to do with a system encountering a case its designers never modelled. Nobody programmed the system to distrust transgender bodies. But a false non-match doesn’t feel like an accident to the person standing at the counter. It’s the direct, traceable consequence of a design choice that assumed away the very possibility of bodily change.
Toward a Different Frame
I want to end where the next piece in this series will pick up. The dominant frame in digital identity work treats exclusion as a problem of absence, asking who lacks an ID, and how do we enrol them. That framing has done very tangible good. However, it also obscures a second, distinct failure mode, one that doesn’t show up in enrolment statistics at all. That’s the mode of failure that this series is interested in. Not the missing ID, but the ID that stops matching the person holding it.
That’s not a legal problem anymore. NALSA settled the legal question a decade ago. It’s an infrastructural question. It’s a question that involves updating workflows, propagating the data changes across sytems that were never meant to talk to each other in this way. It’s also a question of building institutional trust that has to be rebuilt one registration at a time. In the next video in this series, I’ll look at what the costs are for the people caught in the gaps of an infrastructure.
If your organisation manages identity, registration, or eligibility systems, the gap between what policy promises and what your infrastructure can actually deliver is where the risk and the harm accumulates. I work with public and private institutions to audit their systems for exactly this kind of drift between legal entitlement and operational reality. Get in touch to talk about whether your systems might be carrying assumption and biases that they were never designed to hold.
DHIS2 Docker Local Setup Script
A script to set up a local Docker instance of DHIS2 seeded with the demo database and with analytics tables populated for the DHIS2 dashboard.
Quick summary:
What it does: Installs Docker if needed, pulls DHIS2 2.43, spins up a local instance seeded with the Sierra Leone demo database, and (optionally) populates the analytics tables so the dashboard has real data to show.
What it doesn’t do: It’s not a production deployment tool, doesn’t work with other DHIS2 versions or demo databases out of the box, and doesn’t touch any live or shared environments.
Who it’s for: Anyone implementing, evaluating, or demoing DHIS2 who needs a disposable local instance. Consultants, implementers, trainers, etc.
Runs on: Ubuntu (tested on Ubuntu with apt and Docker). Not built for macOS or Windows as-is.
Before you can test a DHIS2 configuration or walk someone through a dashboard, you’ve got to spin up an instance first. Install Docker if it’s not there already, pull the DHIS2 image, seed the database, and then, if you want the dashboard to display, you need to populate the analytics tables. This isn’t a DHIS2 problem. Any system with this much going on has the same setup headaches. But it’s still a lot of steps for something you can end up doing multiple times over a project, and it can eat a whole afternoon that you didn’t have.
This script handles all of this in one pass, on an Ubuntu machine. It checks for and installs Docker if it’s needed. It pulls DHIS2 version 2.43, spins up a local instance seeded with the Sierra Leone demo database, and gives you the choice of running full analytics, just the last two years, or skipping analytics altogether if you’d rather trigger it manually later. Either way, it’s meant strictly for local development, not something you’d point at production.
I built this because I wanted to quickly be able to test a change before it touches a live environment, or to quickly show a client what their org unit hierarchy or data model would actually look like without needing access to their infrastructure. Having the analytics tables populates and ready to use makes a big difference, because a dashboard is much easier to discuss when there’s real data there to demo. That all saves a lot of hassle when demoing and running training sessions.
It’s not a big script, but it’s pretty much my approach to working. If I see the same problem come up a few times, I usually just build a script to automate it because it’s a good way of explaining the system. Some goes for the bigger projects too. Civil registration linking to health data, whether it’s a DHIS2 or OpenEMIS system, whatever is needed.
The script is open source and available here: https://github.com/KatherineWyers/dhis2-docker-local-setup. If you’re mid-implementation and hitting the same setup friction, or you just want to see what the system would look like before you commit to it, just reach out and we can figure out what it’d take to adapt the script to your context.
15 Coding Patterns for Solving Technical Interview Coding Questions
When you’re preparing for a technical interview, it’s good to prepare for solving the data structures problems. Spending hours on LeetCode trying to figure out solutions can feel like you’re trying to reinvent the wheel though. These problems get a lot easier to solve when you start developing an instinct around the patterns you can apply to solve them. Most of the coding problems you’ll come across in a technical interview involve applying on of the 15 coding patterns below. Solving these kinds of questions is really about having a mental model for the different patterns, and recognising which pattern to apply.
In this blog post, I’ll take you through 15 common coding patterns, focusing on the visual representation of what they’re doing. I’ll avoid writing a code implementation because I find it’s much more useful to get a clear mental picture about what’s actually happening, and I want you to focus on building that mental model first instead of diving in and writing code….. so just resorting to asking AI for the answer! What we’re working on here are reusable strategies. Once you recognise them, you’ll be able to turn intimitating coding problems into familiar problems.
Getting through these problems isn’t about memorising hundred of individual solutions. The people who do well on these interview tests learn to memorise a fairly small set of patterns and apply them repeatedly. In this guide, I’ll walk you through 15 patterns that are commonly used to solve various LeetCode questions. I’ll include some code at the end, along with a four-step framework for turning any pattern into a workable solution during your next coding interview.
Why Learn Patterns Instead of Memorising Solutions?
LeetCode exercises are there to test your problem solving skills. So, we need to focus less on solving the problems themselves, and think about what skills you need to solve sets of similar problems. If you learn to apply the patterns instead:
1 , You recognise problems faster: Most of the problems you’ll come across in an interview are questions that are known, but are dressed up a bit differently.
2, You learn to solve novel problems: When you work on learning to apply patterns to solve problems, you’ll be building a real, solid foundation of skillls you can apply to solve any kind of novel problem.
3, You’ll be better able to communicate the solution: By naming the pattern during an interview, you’ll be signalling to the interviewer that you’re a strong candidate who understands the general class of problems that the question is asking about (for example, a sliding window problem with a variable width).
4, It helps you visualise the problem: I find that thinking of the solution as a pattern helps me to visualise what’s actually happening when I implement the solution.
Categories of Patterns
This article describes 15 patterns that I’ve grouped into five categories, based on the kinds of data structures that they work on:
Category
Patterns
Array Patterns
Prefix Sum Two Pointers Sliding Window (Fixed width and Variable width) Overlapping Intervals
Array traversal questions are some of the most common questions that appear in technical interviews. Most can be solved with one of these four approaches: Prefix Sum, Two Pointers, Sliding Window, or Overlapping Intervals.
1, Prefix Sum
Imagine travelling somewhere in stages and tracking the distance between each of your stops. You could log the distance between each individual pair of stages. The would work fine if you only ever needed to measure the distance between adjacent points. But what if you suddenly needed to measure the distance from Point A to Point C, or Point B to Point D? Recalculating those distances from scratch can get really expensive.
So, a smarter approach to this is to do some calculation up from. You build a new array where each cell holds the running total up to that point. Once you have that array, you can find the distance between any two points really quickly, just by subtracting the value at the starting point from the value at the destination.
When to use it: Any problem asking for repeated range-sum queries over an array.
2, Two Pointers
In this technique, you place one pointer at the start of the array and another pointer at the end of the array. You then move them towards each other based on some condition.
When to use it: The variable-size version of the sliding window is especially useful for problems about contiguous subarrays and substrings. For example, questions that ask you to find the longest, or the shortest, or the sum-constrained.
3, Sliding Window
In the sliding window, you basically has a set of adjacent cells on the array that you’re looking at, and you move the window of cells across. The window can be a fixed width or a variable width, depending on the problem you’re trying to solve.
To do this, you create a window of the array by moving two pointers from left to right and evaluating the cells that are inside the window.
Fixed-width window: Both pointers move together, and the window is always a constant width.
Variable-width window: The right pointer always moves from left to right, but the left pointer only moves whenever a condition is satisfied.
When to use it: The variable-width version of the slding window is particularly useful for problem about contiguous subarrays and substrings. For example, when the question asks you to find the longest, or the shortest, or a set that’s sum-constrained.
4, Overlapping Intervals
Imagine you have a set of employees, each working a shift with a start and end time. You want to know which shifts overlap. This pattern gives you a systematic way to sort and merge, or detect overlaps in sets of intervals. To visualise it, think of a timeline, with each interval as a horizontal bar, like on a Gantt chart. If you visualise them, you’ll see where they overlap.
The trick to applying this approach is to sort them first. Even though your instinct might be to compare every interval with every other interval, that’s an O(n**2) approach. We’re looking for something more elegant than that!
Step 1, Sort all intervals by their start time: Once all intervals are sorted, you will only ever need to compare it to the interval directly to its right, not to all others.
Step 2, Walk through the intervals left to right, while keeping track of the current interval’s end time.
Step 3, For each new interval, ask this question: Does this interval start time come before the current interval’s end time. If yes, they overlap. If no, they don’t overlap, and this new interval becomes your new current interval.
When to use it: Use this one for questions about scheduling, calendar-merging, and any question about ‘do these ranges overlap’.
Linked List Patterns
5, In-Place Reversal
In this pattern, you reverse the direction of the pointers in a linked list without using extra memory for a new list. You walk through the list once, flipping each node’s ‘next’ pointer as you go.
When to use it: Use this when you need to reverse a whole list, when reversing a sublist, or reversing in groups of n elements.
6, Slow and Fast Pointers
This one is also known as the ‘tortoise and the hare’. You start with two pointers, and you move through through the list at different speeds, one step at a time versus two steps at a time. If the list has a cycle, you’ll find that the fast pointer will eventually catch up to the slow pointer. Also, when the fast pointer reaches the end, you’ll know that the slow pointer is exactly at the mid-point!
When to use it: This is really useful when you need to find if there’s a cycle in your list, or if you need to find the middle of the list, of finding the kth node from the end of the list.
Stack and Heap Patterns
7, Monotonic Stack
Imagine you’re walking along a street with high skyscrapers. You look at one tower and you have the perfectly normal thought where you ask yourself “I wonder what the tallest building is after this building on this street”…. As I said, it’s a perfectly normal question that we’ve all asked! Well, worry no more. The solution is to use a monotonic stack. Here, you make a stack of the highest buildings to the right of the building. A monotonic stack solves this efficiently by keeping a stack of elements in strictly increasing or decreasing order, popping elements as needed while you scan the array.
This kind of question is useful when you’re asked about a stream of data and you have to answer something like ‘how many consecutive days has this stock price been below today’s price’. To visualise the solution, imagine you’re keeping track of a stack of days that are still relevant to answering the question.
When to use it: Whenever your asked to find the next greater element, or the next smaller element. Also, for questions about stock spans.
8, Top K Elements
Imagine you’re at a marathon running race and you’re interested to know the top 3 podium positions based on the chip time. Each runner crosses the start line at different times, so when they reach the finish line they won’t be in order. You’re going to have to find an elegant way to keep track of which three runners as they arrive. The solution is a Top K Elements pattern that uses a Heap, specifically a min-value heap.
Using the min-value heap, you can quickly access the element in that has the minimum value. Whenever a runner crosses the finish line, you compare their time to the minimum value element in the heap (without needing to look at any other element in the heap!) and if the runner’s time is faster then you just replace the min-value element in the heap with their time.
When to use it: K largest or smallest elements questions, K most frequent, or any kind of question that asks for the top-K elements in a stream of data.
Tree and Graph Patterns
9, Breadth-First Search (BFS)
Imagine you’re in the middle of a maze and you need to find the shortest path to the exit. To be sure you find the shortest path, you can test every single possible path by gradually increasing the distance one step at a time in all possible directions. If you do this, you’re doing breadth-first search, by moving through a graph one level at a time. This approach guarantees that you’ll find the shortest possible path, but, as you can imagine, it also involves you taking a lot of footsteps to get there!!!
When to use it: When you’re asked to find the shortest path in an unweighted graph, when you’re asked to carry out level-order tree traversal, or find the minimum steps to reach Point X.
10, Depth-First Search (DFS)
DFS takes the opposite approach to BFS. Rather then going through each level of the graph (or the maze) step by step, DFS goes as deep as possible into each path, keeping track of which spaces in the maze have been visited. Starting in the centre of the maze, you pick a direction, keep walking until you hit a dead end, then backtrack to the last junction and try the next unexplored option.
DFS usually finds a solution path faster than BFS, but it isn’t guaranteed to find the shortest one. Choosing between BFS and DFS comes down to whether you need to find the guaranteed shortest path (BFS) or just need to reach the target as quickly as possible (DFS).
When to use it: Use DFS when you are connecting components, your are asked to find whether any path exists. It’s used for most of the tree-traversal problems. It’s also used when you need to do topological sort, which is where certain events need to happen in a specific order.
11, Binary Tree Traversal
This pattern covers the standard ways to visit every node in a binary tree: pre-order (root, left, right), in-order (left, root, right), and post-order (left, right, root), typically implemented recursively or with an explicit stack.
When to use it: When dealing with binary search trees, in-order traversal is the most common approach. It visits nodes in the sort order. Pre-order and post-order are commonly used for tree serialisation, deletion, or for expression-tree evaluation.
12, Matrix Traversal
A matrix might sound like a daunting data structure, but it’s just really a grid-shaped graph whenever every cell connects to its neighbour, either up, down, left, or right. Sometimes cells can also connect diagonally. Matrix traversal problems use BFS or DFS to traverse the matrix, exploring connected regions, finding paths, our counting the islands of connected cells.
To visualise this, imagine you’re solving a wordsearch puzzle. If you know that the words will all be letters in a straight line, you’d search in one direction. (all connections need to be in the same direction for the same word, generally). Think about how much smaller the search space becomes if you know that all words can only be written top-to-bottom and left-to-right. Also, think about how you’d solve this wordsearch if you know that the letters don’t have to be in a straight line.
When to use it: For island-counting problems, finding the shortest path on a grid, solving a maze.
Algorithm
13, Backtracking
Backtracking has a similar flavour to Depth-First Search. You explore options, and if one turns out to be wrong, you step back, undo the decision, and try again. The key difference between Backtracking and DFS is that in DFS the path already exists as a fixed structure. In backtracking, you construct the tree of possibilities yourself, one decision at a time, pruing branches that can’t lead to a valid solution. It’s basically how a robot lawnmover or a Roomba works. It hits a wall, reverses, turns a bit, and tries again in the new direction.
While DFS is great for aksing questions like ‘can I reach this goal?’, backtracking is built for exploring an entire decision space, including the dead end ones.
When to use it: When you need all permutations, combinations, subsets. It’s for solving Sudoku, and any question that asks ‘generate all valid configurations’.
14, Dynamic Programming
Dynamic Programming (DP) takes a large problem and breaks it down into smaller overlapping subproblems. It then solves each subproblem once, and stores the result so it never has to be recalculated. This storing is known as ‘memoisation’. Memoisation is what separates DP from standard recursion. Without storing prior results, you’d redo the same work many times.
There are two ways that DP is commonly implemented.
Approach 1: Top-down AKA memoisation: Write the recursive solution and then cache the results as you go.
Approach 2: Bottom-up AKA tabulation: Build a table iteratively, solving the smallest subproblems first and then working up to the full problem.
When to use it: Use DP whenever a problem has optimal substructures, where the best solution is built from best solutions to smaller problems, or where the problem has overlapping subproblems. DP is great for solving knapsack problems, longest common subsequence, or for calculating the minimum or maximum number of ways.
15, Modified Binary Search
Imagine you’re looking through a phone book, where the names are listed in alphabetical order. You go to the middle of the book, see that the name you’re searching for will be before the middle of the book. You then find the middle of the first half of the book (25% into the book…) and continue this process. This is standard binary search, using a ‘divide and conquer’ algorithm. This works really well when we’re dealing items that are perfectly sorted. But what about if it’s not perfectly sorted? For example, if there was a sorted list, but it got rotated and now the sorted list starts somewhere in the second half of the list. Imagine someone’s taken a random pile of pages from the start of the phone book and they’ve stuck it at the end. How can you find your way through the phone book now?
The trick is to think about the search space. Even though a random number of pages were added at the end, and we don’t know how many pages it was (it could be 10% or 70% or anything else!), what we do know for sure is that there’s one half of the book that’s still perfectly sorted. We just don’t know whether it’s the first half of the book or the second half of the book.
To solve this, follow these steps:
1, Find the midpoint of the book, same way as you did in standard binary search.
2, Figure out which half of the book is correctly sorted. You can do this by comparing the start of the array with the midpoint of the array.
3, Check if the target you’re looking for falls inside the sorted half of the book.
4, If it does, then proceed using a divide-and-conquer algorithm on that half. If not, repeat steps 1 to 3 on the other half of the book.
Since you’re dividing the search space in half with each step, you still keep it at O(log n) even though the book isn’t fully sorted anymore.
When to use it: This is great when searching in a rotated sorted array, finding a peak element, or any kind of array-search problem that’s sort-of sorted but not perfectly sorted.
Four-step Approach to Solve Coding Questions
Once you can identity the pattern in a technical coding question, here’s a repeatable framework you can used for turning your pattern into working code. This is my approach to solving these kinds of problems:
Step 1: Recognise the pattern
Read the problem and mathc its shape to one of the 15 patters above. (Obviously, there are other patterns than these 15, so it might not apply, but these 15 are very common)
Step 2: Step Through A Small Example By Hand
Use a tiny input and trace exactly what should happen, cell by cell or node by node.
Step 3: Write some pseudocode
Describe the logic in plain steps. This stage is programming-language agnostic and it forces you to nail down the algorithm before worrying about syntax.
Step 4: Implement it in code
Ok, you’ve got your pattern, you’re sure it works on a tiny input, and you’ve created your pseudocode. It’s finally time to implement it in code. Java and Python are common interview choices for this step, but steps 1 to 3 apply no matter what language you use.
Final Thoughts
Technical interviews reward patter recognition more than they reward raw memorisation. Once these 15 patterns feel familiar, you’ll start to find that the unfamiliar-looking LeetCode and interview questions start to feel like variations on problems you’ve already solved. When you encounter a new problem, start by spotting the pattern before you write any code. This is the single most useful habit that will separate you from candidates who freeze when they face novel questions they haven’t answwered before.
Your next steps: Pick 2 or 3 technical questions on LeetCode for each of the patterns we talked about and practice applying the four-step approach to solving them until it becomes automatic.
Good luck!
How to improve your data-collection and IT systems to make your organization more efficient
Introduction
You have a social enterprise. Over the last few years you’ve seen it grow and develop and you’ve met the people whose lives you’re impacting. You can feel it maturing and you want to help it move forward. To do that, you know that data is important. It helps you show the impact that you’re having, helps you plan out the best use of your funding and helps you communicate to your staff and your donors about your successes and where you want to go next.
How do you manage that data? It needs to be collected and stored, cleaned, and then needs to be analysed. This all needs to happen in the most efficient way, because the less time spent working with data, the more time your enterprise has to grow.
I’d like to show you how I think about data-management, and share a few tips you can use to improve your data-management processes. I’ve worked in data-systems design for the past twelve year, providing support for many different kinds of humanitarian, medical and commercial organisations. These tips will help you reduce the time your enterprise spends working with data, so you can have a greater impact with your time.
The main goal of a data-system is to lighten the work-load for your organisation. It is not to show off a fancy new computer system. So, I favour a balanced discussion about pros and cons, and only swap a pen-and-paper process for a computerised process if they will dramatically improve your organisation’s efficiency. Computers are great when they’re used correctly, but they come with their own challenges and can become a barrier to sustainability if they are not implemented with enough foresight.
Visualizing your data-pipeline
When I’m discussing data-management, I find it helps to visualize the whole system so that we can discuss individual stages. This will help you find the stages that are using up the most of your time, and lets you focus on making improvements to those.
Think of your data-management as a pipeline with a series of stages. On the left, we have the data, swimming out there in the real world waiting to be collected by anyone who want it. Then, over on the right, we have the end-result of the process. This is the presentation of the data for internal or external stakeholders.
I’m deliberately keeping this diagram very generic. This pipeline can apply to you whether you do all your data-collection manually, or if some stages have been automated. Some of the stages are manual and labour-intensive, some are automated using computers. Generally the manual-process and computer-processes are interchangeable, and there are pros and cons to choosing one or the other.
Quick Tip: Computers don’t work any magic. All they do is speed up the processes you already have. If your paper-based data-processes aren’t working correctly, then a computer will only help you do the wrong thing really fast! Fix the manual-process first. Then set up a computer to speed up the process.
Why do we collect data?
Before we start reviewing each individual stage of the data-pipeline, and look for the problems you might be facing, let’s start by first looking at the reasons why you are collecting all this data in the first place. There are two reasons to collect data
To give you and your staff information so you can carry out your day-to-day tasks
Produce reports for internal strategic planning, and for liaising with external stakeholder such as donors or authorities
Internal: Day-to-day tasks
What information do you and your staff need so they can carry out their daily tasks? Make a list of the tasks they do and the information they need while they’re doing the task.
For example, if you run a refugee teacher-training project, your teacher-trainers will need to know the school’s address, the teacher’s name and background, the notes and comments from the last training-session with that teacher. If you run a medical research centre, your researchers might need a subset of the full research-dataset that they can quickly run their analysis.
Internal & External: Strategy, planning and reporting
Ask yourself ‘how do we want to show our successes?’. What information best shows the way the great work that you’re doing, and the positive impact that your organisation is having? What reports do our funders need? What reports did your donors ask for in the past, but no longer need? Make a list of all the reports, both internal and external, that you need.
Your Tasks
List the information that you and your staff need for day-to-day tasks
List the reports that you need to produce to show your impact and liaise with external stakeholder
Looking at each stage in the pipeline
Let’s take a look at each stage in the data-pipeline. I’ll describe each stage, show some issues that tend to appear at that stage, and share some techniques to help you improve that stage of the pipeline.
Think critically about your current system
As you go through this process, I want you to think critically about the data that’s being collected and how it’s being processed. We’re looking to streamline your data-process so that you get the maximum out of your time.
Is this data really necessary? How does it support the internal and external needs we saw earlier?
Are all those external reports really needed?
Is any data being collected that’s unnecessary?
Is there data that you don’t collect yet, but it would be very beneficial to you if you did?
What types of data in your database need to be cleaned? What stage in your pipeline might be allowing in the dirty data?
It takes a lot of time to collect and process data. The less time spent in data-management, the more time you’ll have to carry out the real work of helping people. It’s not always easy to be critical about what’s being collected and what could be collected. Try to stay detached from that for the moment. Just be a passive observer, noting down what you see in your organisation. Then, later, you can make a plan for which changes are worth going after, and which aren’t a priority.
The real world
Description
Out there in the real-world, your users are creating data. Whenever they change address, buy something new, make a meal, go to school. Every time someone does anything, there’s some potential information about that person.
Common problems
One of the major problems is that there are so many different pieces of information you can collect. Most of the information out there is completely irrelevant to your organisation. It’s easy to err on the side of caution, and collect as much information as you can, and then worry later about whether it’s needed. This creates problems, because too much data puts unnecessary demands on your time without helping you show your impact.
A lot of the data in the real world is unreliable. In many cultures, a date of birth is not used, and a person’s age is only an estimate.
Improvements
Only collect the data that you need. Remember to focus on the internal and external needs that your organisation has. All the data you collect needs to help you in some way.
You might come across some data that would be valuable for you when showing your impact. Note this down.
Be aware of the context of your data. For example, is a date of birth a reliable value in the culture?
Getting the raw data inside your organisation
Description
Some of the raw data from the real-world has been collected and is now inside your organisation. This is often stored on paper forms that were hand-written by your users, or during observations by your staff. Those papers might be in a pile on someone’s desk, or in an Excel file sent by a user.
Common problems
The main issues arise here because of the workflow. This stage can quickly become complex when different types of data is collected from different places by different people. Hand-written forms can be unclear.
If some fields/questions are often answered incorrectly, it’s likely that the question on the form is unclear. If your organisation operates in a multi-lingual environment, this is a common issue you may be facing, as the question may be interpreted differently due to varying levels of understanding of the language.
Improvements
If you’re using paper forms, try to limit the number of fields on the form to the data you strictly need.
Read through the responses in your paper forms. Review the questions in the forms, and the written responses, to see whether they are unclear/ambiguous. If there are things written in the margins (there will be!) then it’s a signal that the fields in the form aren’t adequate. If one of the fields in rarely/never being written in, find out if it’s still necessary.
Raw data entered into a storage system (Data-entry)
Description
During this stage, the raw data is moved into long-term storage. There are many different options for how to store your data. If you’re going with a computer-based solution, you can choose to enter it into a spreadsheet, or into a database-system. Entering the data can be done using a custom application, or an off-the-shelf web-based system.
Common issues
The user interface is not clear.
Mismatches between workflow and user interface. Mismatches can cause the computer-system to get in the way of the workflow, which causes frustration. Leads to people finding ways to work around the system in order to carry out their tasks.
Computer-based data-entry needs to correctly validate the data. If the upper and lower boundaries of the data aren’t set, then it’s human nature that eventually some data will be entered incorrectly and it’ll be allowed into your database.
Improvements
When you’re optimizing your data-processes, you’ll learn a lot by being a passive observer while the staff carry out data-entry. Even if you think the user-interface on your database is crystal-clear, I guarantee you’ll have some surprises when you watch a few people using it!
Add validation to the system. Check the upper and lower boundaries of the data and make sure that the computer validates the data so that data can’t be stored that isn’t within sensible ranges
Raw data stored
Description
At this stage, the raw data has been entered into long-term storage and it’s sitting there quietly waiting for you to use it. The data can be digital or paper-based.
Common Problems
Data security: The major issues with resting data is data-security. How easy would it be for someone to get access to the data? Is it possible for someone to accidentally share the data?
Backups: Is the data backed up correctly? One of the major objections I have to paper-based storage of data is that it’s not easy to back it up. Things go wrong with paper-forms. Damp, fire, flooding… even just that the pencil marks fade over time… paper-based forms are volatile and need to be carefully stored. On the other hand, backups is one of the areas where computers win. It’s so easy and quick to do, it’s far more likely that the data will be backed up regularly on a computer system.
Improvements
Store your data securely. Find out who has access to the data, and put policies in place to ensure it’s not shared accidentally.
Make sure that your data is being backed up regularly, and that those backups are stored somewhere safe, in a different building to the main system.
Data retrieval and analysis
Description
At this stage, you take the raw data that you’re storing and assemble it together to present it. You’ll do some calculations to analyse the data. You might list out all the items in your data. You might get a percentage of all the raw data, or select a subset of the data from a particular month or year.
Common problems
While this task can be done manually, it is far more efficient to program a computer to do this. Computer-systems are a perfect solution either, and problems can arise when you need to produce a new report. In the real-world, change is inevitable. If an donor has a new reporting-requirement, something new in the M&E reports, a new metric they need to track, your organisation will need to be able to program the computer to carry out the calculation. You need to avoid the situation where you have a system that works great for a few months, but that you can’t adapt. As the reporting requirements changed, you need to be able to implement those changes. Otherwise you’ll find that whenever there’s a new report, you’ll have to revert back to the slow, tedious task of doing manual calculations.
Improvements
Make sure that the systems you use to do the calculations is something that your organisation can adapt as needed. Ideally, this would be someone within your organisation, possible with support from someone outside with further expertise.
Whenever a new report is requested, I find that there’s a knee-jerk reaction to just calculate it manually. This should be avoided. It’s much better for your organisation to have someone spend that time learning how to implement the new calculation as a formula in code or in Excel. Preferably, that person is a staff-member who can be tasked with maintaining the formulas in your data-system.
Report produced and used
Description
The results of the analysis are compiled together and presented for use. This can be the information that’s needed internally for the day-to-day operations. It can also be for strategic planning at management level, and for quarterly M&E reports for donors and other external stakeholders.
Common problems
The main problems I’ve seen here revolve around the number of reports that are being produced. As I said earlier on, the whole purpose of the data-system is to be able to produce information so that you and your staff can work better. Often, there are reports that were needed in the past, but they aren’t used anymore. When you find a report that isn’t used anymore, it’s best to remove it from the system. Maintaining those calculations will take time, so avoid having reports being generated that aren’t needed. If you’re worried that you might need the report in the future, you can keep collecting the data into your database, and just set up the calculations in the future when you need the report again.
Improvements
Ask yourself whether all the reports are needed. If you find a report that’s no longer needed, remove it.
When a new report is needed, encourage your staff to implement it in code or in and Excel formula. Avoid the knee-jerk reaction of doing it manually. It will grow the skills of your staff and will make them more confident in the long-run.
Conclusion
We’ve looked at the data-pipeline, and I hope you’re starting to see how this idea can help you improve your own data-processes. Each stage can be manual or computerized, and the choice between one or the other should be based on a discussion of the pros and cons. Computers won’t always be the best solution for each stage. Sometimes it helps to automate a manual process using a computer. Sometimes it even makes sense to take an automated process and make it manual.
Manual processes tend to work well in the early stages of the pipeline. The early stages of the pipeline are more involved in the real-world where workflows change quickly and where data-collection systems need to be able to adapt to change. As the data moves down the pipeline, it becomes more and more useful for it to be digitized so that it can be easily backed up, analysed and presented as a report. Of course, the more you rely on digitized data, the more skills your organisation will need so that the changes in the real-world can be implemented in the software and the databases.
The key is to get the most out of the time that you and your staff have. If a process is taking a lot of someone’s time, and it’s clear to you that the process is helping you have an impact, then see if you can make it more efficient. Each stage in the pipeline has different things that can be optimized and improved. Look for the bottlenecks, and see if it’s an easy fix. Your enterprise will become more streamlined, and you’ll have more impact with the same amount of time and effort.
What kind of bottlenecks do you see in the data-pipeline at your organisation? What can you do to make them more efficient. Let me know in the comments below.
AI and memory: Are we letting the machines help us to forget?
I was recently chatting over lunch with a researcher. We were discussing AI, and whether large language models like ChatGPT produce anything new, or whether they only reuse what is already there. Generative large language models determine what word comes next using probability, so she leaned on the side of AI producing nothing new, and I disagreed. Which got me thinking about what it was that AI produces.
Zuboff (1985) talks about how intelligent systems informate as a process that translates raw data (if there is such a thing… (see Gitelman 2013)) into information that can be used by an organization. Through this process, the intelligent system produces something new. This is a visible form of production. The ‘something new’ is a report, a pie chart, a distillation of the raw data into a more palatable, actionable format. However, there’s something else produced that is also new. By distilling the raw data into information, the AI is also producing an absence. Certain aspects of the data are removed, ignored, forgotten. Stefan Timmermans dramatically describes this process during the creation of categories and standards. ‘Classifying is a memory practice to both hold on to certain characteristics and send other elements into oblivion’ (Timmermans 2015 p6, see also Bowker 2008). So, what is it that is being remembered by AI and what is being forgotten? What are we letting an AI cast into oblivion?
I think it’s important to consider what absence is being created, and whether we can let an AI decide what to forget on our behalf. Consider a literature review conducted using ChatGPT. The AI model will select what it considers to be the most salient aspects related to the research question, input through the prompt. It draws the insights from the literature across tens, hundreds, maybe thousands of research papers to give a concise overview of the literature. But how do we understand this overview? It’s much more that a summary, because a summary is by its nature the result of the jettisoning of features that are not considered to be salient. It’s a forgetting. The features not salient are cast into oblivion.
Invisibilization is a theme that’s close to my own research on identity recategorization. When an identity is recategorized, the categorical borders are shifted. People who were once invisible become visible, and some who were visible disappear, which shapes policy decisions in health and welfare provision. For example, take the hypothetical case of an AI-supported systematic literature review to understand health inequities among transgender people. An AI could be prompted to draw insights about the size of the transgender population, and the access to healthcare. However, there is a huge amount of contexts and nuanced meaning-making around the terminology used by and about this community, to say nothing of the privacy concerns and the need of the population to remain hidden for their personal safety. Without this depth of appreciation of nuance, any study conducted by an AI would create an absence, and this absence would persist into the literature, and the subsequent policy decisions, where it will linger potentially unseen but no less powerful. This absence did not exist before the study was conducted. Or, certainly, it was an absence that was known.
Now, one could argue that such an absence could have been created by a human researcher too. And this is of course true. But a large language model is developed to be generalized, to work well with the average. It does not have the training of a professional researcher with domain expertise. When working with quantitative or qualitative data about a specific context, it is vital to understand the nuances of that context. Otherwise, we are producing absences that have material effects.
AI models do produce something new. They produce absences. They make us forget. They decide what characteristics we hold on to, and which we send into oblivion. And this is an absence that needs to be better understood and theorized as we come to use and rely on them more.
References
Bowker, G. (2008) Memory Practice in the Sciences, MIT Press, Cambridge MA.
Gitelman, L. (2013) Raw Data is an Oxymoron, MIT Press, Cambridge MA.
Timmermans, S. (2015) Introduction: Working with Leigh Star, in Boundary Objects and Beyond: Working with Leigh Star, Ed. Bowker, G., Timmermans, S., Clarke, A, and Balka, E. MIT Press, Cambridge MA.
Zuboff, S. (1985) Automate/informate: The two faces of intelligent technology, Organizational Dynamics, Elsevier Press.
Planning for sustainable data-management projects in developing countries
What is sustainability in development projects?
Sustainability is a term that’s often used nowadays. It usually means ‘green’ projects that aim to reduce our impact on the environment. Within the context of projects that support developing countries, the concept of sustainability is used to describe how well a project survives after the implementation phase (and the funding!) has ended. Projects with six months of funding might show all the signs of success, but after those six months are over, the implementation team has moved on to another project, and the local team are left to maintain the project, how long will it last?
Project-sustainability is closely tied to local ownership, the ability for the local beneficiary to maintain the system, take it as their own, adapt it to suit their own needs and make decisions about it without relying on support from outside. These concepts have been part of the development studies field for over fifty years, and nowadays, any western aid project designed for a developing country should consider the long-term sustainability, addressing how the local community can take ownership over the project.
What does ‘salmon fishing in the Yemen’ have to do with IT projects in Myanmar?
I watched one of my favourite movies yesterday, ‘Salmon fishing in the Yemen’. It’s a great movie about a fictitious project, funded by a Yemeni sheik and lead by a British scientist and a British project manager, where fly-fishing is introduced into the Wadi in the Yemen. Not to spoil the plot of the story… but one of the subplots is the danger of running with a development project without close collaboration with the local community. The technical parts of the salmon project are fine, but there’s a lot more to a development project than just overcoming technical hurdles. Yemeni terrorists send signals throughout the project timeline, and the project-team don’t properly involve the Yemeni people, which lead ultimately to the failure of the first version of the project. Ultimately, Ewan McGregor’s character changes his plan for the renewed version of the project, involving the local community, have a manageable scope.
The lesson from the movie is that development work is more than just the overcoming of technical hurdles. There needs to be local ownership, and a long-term plan for how the project will persist. The project needed a fisheries expert at all times. Without the availability of that kind of expertise, it would be doomed to failure.
From fishing to phishing…
That brings me to IT projects in developing countries, sometimes referred to as information and communication technologies for development (ICT4D). Clearly ICT can play its part in helping to solve many of the problems in developing countries. Better data storage, dissemination of knowledge, communication that reduces the need to travel… There are so many potential benefits.
The problem is that ICT4D projects are complex. There are so many complicated pieces in the puzzle, computers, laptops, smartphones, network connections… Then there’s the software that runs on the devices. This complexity is reflected in the huge failure rate for ICT4D projects. Richard Heek estimates in his fantastic textbook ‘ICT4D’ that over 70% of ICT projects in developing countries fail.
Recognise when a project will need expert maintenance
One of the major barriers to the success of an ICT project is its continued reliance on expertise. A salmon-fishing project in the Yemen is sustainable, provided that a multimillionaire sheik can afford to fund the ongoing maintenance of the system by a fisheries expert (in fact, this wasn’t even the plan at the start of the movie. The original plan was that Ewan McGregor’s character would be involved in setting it up. He only committed to it long-term in the middle of the story. Without that commitment, there was no way the project would have been sustainable.. but I digress).
If a project needs expert maintenance, and the expertise is not available locally, then the project is very likely to fail. So, either the project has a long-term commitment for funding (in IT, this should be about 5 – 10 years), or else the project need to be fundamentally redesigned BEFORE it is given the green light.
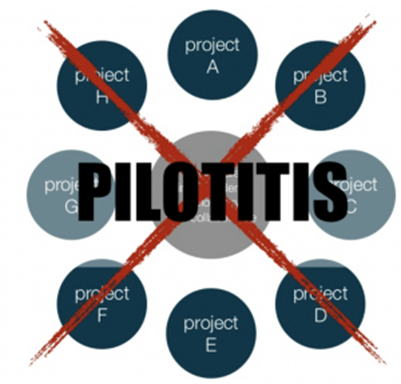
Pilotitis
The enormously high failure rate for ICT4D projects has been coined ‘pilotitis’. Projects are poorly designed, and they never survive beyond the pilot stage. We need to do better.
What can we do?
1, Expert maintenance skills
Recognise that any expertise you are offering will eventually need to be handed over to a local team-member. If any of the maintenance work involves expertise that is not available locally, there is a high risk that the project will fail after you leave.
2, Innovate in the implementation before the technology
Avoid innovation. The more you innovate, the less likely it will be that the local team will be able to find the expertise to maintain the system after you leave. If you want to innovate, then be innovative in your approach to implementation. It’s true that there have been amazing advances in technology in the past decade. But many (most?) the problems that ICT4D can solve in developing countries can be solved by innovative implementations of old technology. Blockchains are exciting, IoT systems are fascinating, but unless the technology is understood by the local teams, and unless they can maintain it and adapt it themselves, then the projects are likely to fail.
3, Get used to using Excel and Access
I know… Excel isn’t a database, and Access is notorious. But they give the user full control over their own data and their own workflows. Get used to it. If you want to replace their antiquated Access database with a Laravel PHP webapp on an AWS webserver, you’ll need to have a really good reason, and you need to be 100% certain that someone at the beneficiary team is well-versed in Laravel, PHP, webserver maintenance and security. Otherwise, you’d be better off spending your time training the team in Access database design, because that’s probably a more sustainable solution.
What jazz taught me about boundary objects and interdisciplinary collaboration
I’ve been reading a lot about boundary objects lately. Boundary objects are loosely-defined artifacts, categories, or documents that facilitate partial cooperation across communities of practice (Star and Griesemer 1989). The basic concept is that you can have ‘collaboration without consensus’. It’s not necessary to fully agree on the meaning of a boundary object for it to be a useful tool for cross-disciplinary collaboration. So, for example, prototypes in software development can serve as boundary objects to bridge knowledge boundaries between software developers and UI designers (Huber et al 2019).
Reading about boundary objects got me thinking about when I used to play jazz music, and how collaboration works in music improvisation. Jazz is inherently fluid and dynamic. This is exactly what makes it such an exciting artform. In many ways, jazz is the process of creation rather than the music itself. Louis Armstrong said ‘Jazz is what you do with music’. It’s a real-time collaborative project where multiple people engage in the process as a team to create something new and exciting. The excitement of making the music, and of listening to it, comes in part from this meeting of different people who have a shared reference point which is used by all participants during collaboration. This shared reference point is known as the lead-sheet.
A lead-sheet is piece of paper that the musicians each share when working together. Lead-sheets can range from a barebones chord structure like the often-used lead-sheets from The Great American Songbook, like George Gershwin’s Broadway show tune A Foggy Day (Fig 1), to a detailed, intricate description of all the notes and articulation. It can even just be a symbol or shape, like Anthony Braxton’s Kandinskyesque lead-sheet for Composition #10 (Fig 2). The skill of the jazz composer is to understand how much shared meaning needs to be inscribed in the lead-sheet for the process of collaboration to be effective. To do this, the composer needs to understand the shared meaning that overlaps between each band member, which gives the composer a sense of how much, or how little, to write into the lead-sheet to stimulate an engaging experience for the performer and the audience. The usefulness of this loosely-defined document comes from its ability to facilitate collaboration across the sometimes contradictory influences of the band members.
Fig 1: Gershwin’s A Foggy Day lead-sheet
Fig 2: Anthony Braxton’s graphic lead-sheet for Composition #10
Fig 3: Miles Davis: Kind of Blue
In 1959, Miles Davis recorded his iconic jazz album Kind of Blue. The album opens with a piece titled So What. If you listen to the recording, and then look at the lead-sheet (Fig 4), you’d almost be disappointed to see how little is actually written on the lead-sheet; Just a simple melody and some chords every few bars. There’s almost nothing there!
Fig 4: So What lead-sheet with Bass melody and Horn chords
But that, of course, isn’t the full story. Miles knew exactly what he was doing when he wrote that lead-sheet, and when he hired the musicians for that recording session. He picked musicians who were similarly interested in the process of exploratory music-making. Davis knew exactly how much or how little needed to be on that lead-sheet for this process of jazz creation to unfold between the band members. While each of the players have very different backgrounds and influences, there was an overlap that the lead-sheet taps into. Pianist Bill Evans, who lays the sublime piano introduction to So What, once said that ‘jazz is not a what, it is a how’. Part of the genius of Miles Davis is that he constructed the loosely-defined lead-sheet with as little detail as was needed to stimulate the collaboration. John Coltrane and Cannonball Adderley both play saxophones on the recording, but their playing style are so very different. This lead-sheet functioned as a boundary object shared by these musicians, allowing for enough overlap between them while still giving enough scope for interpretive flexibility to make the collaboration fruitful for everyone involved.
Nicolini et al (2012) write about how boundary objects function in cross-disciplinary collaboration. They have the capacity to serve as bridges between social and cultural worlds. Their fluidity of meaning can be an advantage for creating this cross-disciplinary work, which is certainly the case with So What. It’s also interesting to think of how the meaning of a boundary object is co-constructed through iterative cycles. So, rather than saying that So What was composed by Miles Davis, it’s probably more accurate to say that the So What lead-sheet was a boundary object that enabled the quintet to coordinate and compose collectively, co-constructing the meaning and capturing this in a studio recording. (Although, for the purposes of copyright, I’m sure that Miles would have disagreed with that!).
There’s a lot more to unpack here about how a lead-sheet functions as a boundary object in interdisciplinary teams, including the question of how much the meaning of the boundary object should be fixed to begin with.
When introducing a boundary object, it’s important to understand the overlaps across communities of practice. There doesn’t need to be complete consensus about the meaning of the boundary object, but there needs to be some overlap for fruitful collaboration. The purpose of a boundary object is to facilitate collaboration. These objects can have different meanings across the various communities, but their structure is common to all groups so they are recognizable and useful. In this case, Miles Davis intentionally created the So What lead-sheet as a boundary object for collaboration, and it was incredibly effective because of his understanding of the overlaps between the communities of practice. Since he wrote the lead-sheet, So What has been played thousands of times by different groups, each time producing a different process, a different collaborative outcome, but always tapping into both the shared and differing meaning that musicians give to the lead-sheet. As with interdisciplinary collaboration, while the end result of the process might not always be clear from the outset, a useful boundary object lets the participants work together to ‘collaborate without consensus’, and to produce novel, interesting outcomes.
References
Huber T, Winkler M, Dibbern J, Brown C (2019) The use of prototypes to bridge knowledge boundaries in agile software development, Information Systems Journal, Wiley Publishing.
Nicolini D, Mengis J, Swan J (2012) Understanding the Role of Objects in Cross-Disciplinary Collaboration, Organization Science, Informs Publishing
Star and Griesemer (1989) Institutional Ecology, ‘Translations’ and Boundary Objects: Amateurs and Professionals in Berkley’s Museum of Vertebrate Zoology, 1907-39, Social Studies of Science, Sage Publishing.
Uganda’s Anti-homosexuality Act 2023: Implications for Safeguarding LGBTQ+ Personal Data
This week, the Ugandan president signed an anti-LGBTQ+ law that has been condemned as a ‘permission slip for hate and dehumanization’. The law imposes the death penalty or life imprisonment for ‘certain same-sex acts’, up to 20 years in prison for ‘recruitment, promotion and funding’ of same-sex ‘activities’ and a 14 year sentence for anyone convicted of ‘attempted aggravated homosexuality’ (Guardian 2023). This law criminalizes people who have been identified as LGBTQ+, and such measures have serious implications for organizations involved in the development and use of platforms and databases for collecting, storing, and sharing identity data.
The criminalisation of LGBTQ+ identities is not unique to Uganda, or unique to the 2023 Act. The criminalization of these communities takes place in many countries around the world. In Africa alone, only 22 of its 54 nations allow homosexuality (Reuters, 2023) and there are many cases from the 64 countries that criminalize homosexuality (BBC 2023) where LGBTQ+ people have been convicted for their mere existence. In 2010, a Malawian gay couple was sentenced to 14 years in prison (UN 2010) and the following year, a gay man in Cameroon was arrested in connection with a text message he sent to another man where he said ‘I’m very much in love with you’ (Guardian 2014). In 2023, a gay Chinese blogger was arrested in Russia for publishing a blog post that was deemed to violate the so-called same-sex ‘propaganda’ law simply for suggesting that a gay sexual orientation is normal (CNN 2023).
The criminalisation of LGBTQ+ identities creates a core tension for database owners who collect and store personally identifiable data who operate in these countries. Typically, the security measures around data handling exist to ensure that personal data does not fall into the wrong hands, where it can be used unlawfully. However, in the context of Uganda in the wake of the anti-homosexuality Act, it is the legislation itself that dictates that LGBTQ+ people must be identified and criminal proceedings be brought against them. Enforcing such a law requires evidence to prove that an individual is engaged in same-sex acts, or has been conducting activities that could be viewed as being the ‘recruitment, promotion and funding’ of LGBTQ+ identities (Guardian 2023). Such evidence needs identity data, which makes databases with identity data a potential source where such evidence could be drawn from or inferred.
Data that can be used to provide insight into a person’s behaviour or practices can potentially be used to infer their sexuality or their gender identity. Such data can come from healthcare, from population census data, and from public health surveillance. It can come from the connections and interactions people have on social media. It can even come from GPS trackers used to determine whether a person has attended an LGBTQ+ centre or correlated with other data to infer who the individual has met.
Since identity data can be used to identify LGBTQ+ identities, database owners are faced with a challenging dilemma. They need to conduct their work and safeguard the identities of the persons whose data they store, whilst also complying with national legislation and with the demands of the government. Any database owner or platform owner whose tools collect and store such personal identifiable data must consider the implications of their work within this new legal landscape. In the current climate, if the Ugandan government calls on a database owner to share such identifiable data, the government could potentially use the legislation to make this demand. Sharing such data could expose LGBTQ+ people to risk of conviction under the Act.
Database owners have a responsibility to safeguard the personal data within their database that can be used to identify individuals. However, when a database owner operates within a country where an LGBTQ+ person’s identity is criminalized, they must consider the ethical implications of their work and plan for how this safeguarding can be ensured.
How to install and configure OpenEMIS
This page contains
Introduction to OpenEMIS features
How to install OpenEMIS with Docker
The three parts of the OpenEMIS Docker application
How to configure OpenEMIS for the first time
If you already have an installation of OpenEMIS up and running and you just want to configure it, skip to the section titled Configuring OpenEMIS.
What is OpenEMIS?
OpenEMIS is an open-source data-management software package for education management. It was developed with support from UNESCO. It is a tool that be used to build sustainable education data-management systems. It can be implemented in many different ways, and this enables it to be configured for various different contexts, in both the global North and the global South. The software has many useful features that make life easier for system administrators and education authorities.
Bulk importing of data
The bulk-importer lets you import student and teacher data from an Excel spreadsheet or a csv file. This enables you to quickly migrate data from an old system without needing to manually type the data.
Managing user permissions for administrators, schools and donors
With the User/Group/Role module, the administrator can easily manage access permissions for each user. This enables them to grant access to specific schools, and specific types of student information. This can let them make school-statistics available to donors, while keeping personal student information only available to school managers.
The software is open-source
Since the community edition of the software is open-source, it is free to install and use. This helps to make the system financially accessible for low-resource projects.
Insufficient documentation for OpenEMIS configuration
The problem I found with it was that it’s very difficult to configure for first use. The project has a website https://support.openemis.org/core/en/home-en where you can find documentation explaining how to work with the software once it’s installed and configured. The documentation is quite good for this, but I found that there isn’t enough documentation explaining how to install the system, and how to configure it so that it is ready for you to enter school data and student data. If it’s not configured correctly, it gives cryptic 404 error messages, which quickly gets very frustrating.
OpenEMIS as part of a sustainable data-management system
I recently built a sustainable data-management platform for a regional education authority in Thailand. Change is inevitable in software systems and information systems, so a sustainable system must be able to be adapted and modified easily without relying on external support. The goal for this system was to create a secure online system that could then be handed over to the local IT team, who would maintain it and change it as the education-system changes.
In order to maintain the system, the local IT team needed to easily see how the platform was configured. To help make it easier for them to maintain, I wrote documentation so they could see the steps for how to configure OpenEMIS. The documentation is below. Hopefully it will be helpful for another low-resource education project and it’ll help more people to collect high-quality data and make it easier for them to show the impact.
How to install OpenEMIS
Warning: The following steps will install the OpenEMIS system on a local development server using port 80. To use the system on a production server, you will also need to configure an SSL certificate to encrypt the data.
For this project, I carried out the OpenEMIS installation using a Docker container available through Docker hub. This is an official release maintained by the OpenEMIS team, so it is likely that the project will continue to be maintained for the long-term.
Install Docker
Docker is a technology that lets you run an application inside your computer. It makes life a lot easier for developers because you can set server configurations in one file and quickly get a project up and running. Once you have docker installed, you can use it to install OpenEMIS.
The OpenEMIS Docker project has instructions for how to install Docker on your computer/server, and how to use Docker to get the OpenEMIS app: https://hub.docker.com/r/openemis/core
With Docker installed, rundocker pull openemis/core This will pull the OpenEMIS application from the docker-hub repository and install it on your server. You can see the application running by typing docker-compose up -d and visiting http://localhost:8082 By default, the OpenEMIS docker container runs on port 8082.
To stop the application, type docker-compose down
You can change the port to port 80 by editing the <project-directory>/core/docker-compose.yaml file. You should only use port 80 for a development server. When you deploy to a production server, you will need to use port 443 and an SSL certificate before deploying OpenEMIS to a production server.
You can quickly set the application to listen on port 80 by changing the docker-compose.yaml to the following (you’ll need to turn off Apache2 if it’s installed, so that it’s not listening on port 80):
ports:
- "80:80"
A better way to set it up is to make an Apache virtual host with port forwarding, forwarding port 80 to port 8082, the default port for docker.
First, install mod_proxy and other requirements
sudo a2enmod proxy
sudo a2enmod proxy_http
sudo a2enmod proxy_balancer
sudo a2enmod lbmethod_byrequests
Next, update the virtual host to forward port 80 to port 8082.
The docker-compose.yaml can stay at its default, listening on port 8082.
#/var/www/openemis/core/docker-compose.yaml
ports:
- "8082:80"
The OpenEMIS Docker application
There are three parts to the OpenEMIS docker project.
The OpenEMIS PHP application
This is where the code of the application is stored. You access it by visiting http://localhost and logging in. When you log in for the first time, you can use the default administrator login account.
Username: admin
Password: demo
MySQL database
The MySQL database stores the data for your application. It will store the schools, students, and system configurations
phpMyAdmin
This is an application that lets you connect to your MySQL database using your web-browser. You can use it by visiting http://localhost:8083 and logging in. When you log in for the first time, you can use the default administrator login account.
Username: admin
Password: demo
Need More Advice for your OpenEMISImplementation?
I’m available to discuss your setup and to help you get your system working smoothly. Get in touch to send me a message, or click here to schedule a call with me to discuss your system.